On Friday 23rd August this year, the Supreme
Court of the Canadian province of British Columbia in Vancouver dismissed with
prejudice a libel action brought by Michael Mann, director of the Earth System
Science Center at Pennsylvania State University, against retired Canadian
climatologist Tim Ball. Despite
receiving almost no attention in the mainstream media, this ruling
represents a pivotal development in the climate change debate. For by throwing
out Michael Mann’s case, the court effectively vindicated Tim Ball’s claim that
the famous ‘hockey stick’ graph, published by Mann and two co-authors in 1998
and prominently cited in the IPCC’s Third Assessment Report in 2001, was a
scientific fraud.
To fully appreciate the significance of this, however, one must
first understand what the hockey stick graph was intended to achieve. For up
until Mann’s publication, it had been generally accepted that our planet’s
climate had varied significantly, not just in the distant past when dinosaurs
roamed the earth and tropical plants grew in Alaska, but even in the relatively
recent history of the last thousand years, which, up until 1998, climatologists
had divided into three more or less distinct periods: the Medieval Warm Period,
which was believed to have lasted from around 950 CE to around 1250 CE; the
Little Ice Age, which was believed to have reached its nadir in the second half
of the 17th century, when the Thames froze over each winter,
allowing ‘ice fairs’ to be held on the river outside the Palace of Westminster;
and the Modern Warm Period which was believed to have started sometime in the
middle of the 19th century and is thought to be still in progress. In
fact, so widely accepted were these three climatological periods that both the
Medieval Warm Period and the Little Ice Age were prominently displayed on graphs,
both in the presentation given to Congress by James Hansen in 1988 – the event which first brought
the theory of Anthropogenic Global Warming (AGW) to the wider public’s attention
– and in the IPCC’s
First Scientific Assessment published in 1990.
For proponents of the AGW theory, however, this apparent
evidence of a natural variability in the earth’s climate posed a number of
serious problems. For if the climate had both warmed and cooled a number of
times prior to the industrial revolution, then there had to have been factors other
than carbon dioxide at work affecting it. Moreover, this being so, one could
legitimately ask whether climate scientists were not therefore obliged, not
only to discover what these other factors were, but to investigate whether they
were still operative in the climate today and to determine how much they might
be contributing to current global warming. As a result, the very existence of
the Medieval Warm Period and the Little Ice Age not only threatened to
undermine the central premise of the AGW theory – that it is man-made carbon dioxide, liberated as a
result of burning fossil fuels, that is the primary cause of climate change – but actually risked
undermining the science of climatology altogether as it is currently structured.
For not only is it unable to answer these fundamental questions, but it is largely
ill-equipped to do so, many of the answers almost certainly lying outside its
current range of competencies.
The only solution, therefore, was to erase both the Medieval
Warm Period and the Little Ice Age from the climatological record. And so that
is what Michael Mann did. In what he called ‘a new statistical approach to reconstructing
global patterns of annual temperature’, he expunged from history any
significant variation in the earth’s climate prior to the 19th
century, replacing the graph shown in the lower half of Figure 1
with the new flattened out version in the upper portion, which shows no
significant warming of the climate until the 19th century and which
consequently looks a bit like a hockey stick.

Figure 1: Michael Mann's Rewriting of History
So how exactly did he achieve this transformation? Good
question! The answer, however, is that nobody knows. For despite numerous
requests from other scientists for him to release his data and explain his
methodology, for twenty years Michael Mann has resolutely refused to do either,
claiming that both the data and the methodology were his intellectual property,
even though his research was actually funded by Pennsylvania State University
and therefore by the taxpayer.
The inevitable result, however, was that speculation on
these matters very quickly became rife, with a number of scientists trying to generate
the same results using different methods, all of them without success, thereby
giving rise to a widespread suspicion that the only way in which Mann could
have produced such a uniform data series was by splicing together data from
different data sets: a suspicion which will probably make more sense once one remembers
that even in a country like Great Britain, with a long scientific tradition,
recorded temperatures measured using some kind of thermometer only date back a
little over three hundred years, and that the temperatures of earlier periods
therefore have to be calculated from what is known as proxy data: tree rings,
lake bed sediments, ice core samples and the like. The problem with calculating
temperatures in this way, however, is that while it may be relatively easy to
detect changes in temperature within a single proxy series – wider tree rings, for
instance, indicating better growing seasons and therefore higher temperatures – it can be far more
difficult to calibrate these relative changes within a series to the absolute
temperatures of a standard metric. Even though different data series based on
different proxies and using different methods of calculation may all show the
same relative changes in temperature over time, it is quite possible,
therefore, for them all to translate into slightly different absolute
temperatures. To get rid of the Medieval Warm Period and the Little Ice Age, all
Michael Mann had to do, therefore, was use a data set with a relatively low
calibration to measure the former and splice it together with a data set with a
slightly higher calibration to measure the latter. And this is what many people
believe him to have done.
Not, of course, that anyone was particularly keen to call
him out on the matter. For even as early as 2001, the climate science community
was already becoming grossly intolerant of anyone who questioned the AGW
orthodoxy, with dozens of scientists around the world being denied funding for
their research and even hounded from their jobs. Prominent names who have
suffered in this way over the years include Roger Pielke, who was forced to
resign from his position as Professor of Meteorology at the University of
Colorado after a publishing a paper in which he statistically demonstrated that
extreme weather events had not become more frequent as a result of global
warming, and Judith Curry, who was similarly forced to abandon her position at the
Georgia Institute of Technology for daring to suggest what everyone had taken
for granted before Michael Mann’s rewriting of history: that our endlessly variable
climate is almost certainly determined by many more factors other than just the
one currently in vogue.
The result was that it was largely left to retired
climatologists such as Richard Lindzen, Emeritus Professor of Meteorology at
MIT, to criticise what he was the first to call the increasing ‘alarmism’ in
climate science, and another ex-professor, from the University of Winnipeg, Tim
Ball, to challenge Michael Mann directly, famously commenting in a recorded
interview that he thought ‘Mann should be in the State Pen, not Penn State’.
Rather than simply letting the comment go, however, Mann
decided to sue Tim Ball for libel in the Canadian courts: a move which took just
about everybody by surprise, not only because resorting to the law was not
generally deemed to be an appropriate way of resolving scientific disputes, but
because, to anyone who understood how the law functions, it was immediately
obvious that, in order uphold his complaint, the Canadian courts would require
Mann to disclose precisely what, by then, he had been refusing to disclose for
more than ten years: his data and his methodology. In fact, so extraordinary and
apparently misjudged was Mann’s action that it is widely suspected that he
didn’t actually realise that this would be the case. Once committed, however,
he then had no choice but to spend the next eight years trying to avoid the
legal consequences of his impetuous bravado, continually promising to produce
his data as the court instructed, but then continually finding reasons not to
do so, until on 23rd August 2019, the Supreme Court of the Canadian
province of British Columbia finally decided that it had had enough and
dismissed the case with prejudice, meaning that Michael Mann could not bring the
case again, or at least not in Canada.
Not, of course, that he was in any way embarrassed or fazed
by this. In fact, he was back on television within a couple of weeks demanding
that all American universities declare a ‘climate emergency’. Nor has it
affected the widespread consensus on climate change, either in the media or in
the minds of the public at large, not least because, with the entire court case
having largely gone unreported, very few people know about it. Thus while you
and I and few dozen others may feel justified in regarding Mann’s refusal to
disclose his data as a tacit admission of his guilt, for the IPCC, most world
governments and the mainstream media, both the Medieval Warm Period and the
Little Ice Age continue to have never existed, leaving carbon dioxide as the
sole factor affecting climate.
While others may shake their heads in bewilderment and
frustration at the seeming impossibility of ever being able to get a
politically blinkered establishment to change its mind on this issue, however,
my own primary interest is rather in how this state of affairs could have come
about. How did it happen? And why? Why did Michael Mann decide to commit
scientific fraud rather than simply follow the evidence wherever it took him?
After all, that’s what scientists are supposed to do, isn’t it? Especially in a
field as young as climatology, with so many unanswered questions and so much
still to be discovered.
I say this because a couple of years ago I had the good
fortune to stumble upon a lecture –
which you can find here – given by Carl-Otto Weiss,
a retired professor of physics at the Physikalisch-Technische Bundesanstalt in Germany,
who, along with a couple of other retired colleagues, came up with the novel
idea of subjecting climate data to spectral analysis.
For those not acquainted with this particular mathematical
technique, spectral analysis is what is used to isolate electromagnetic signals
of different frequencies from a background of ‘white noise’. However, it can
also be used to reveal recurring or cyclical patterns of different periodicities
in large data sets: patterns which may otherwise be lost due the fact that,
being of different lengths, their effects will sometimes reinforce each other
while, at other times, cancel each other out, giving rise to a combined data
series in which no overall pattern may be discernible.
Now, of course, a data series with no discernible pattern
may be just that: a data series in which the changes to the values are the
result of purely random influences with no underlying pattern to them at all. Applying
spectral analysis to climate data, therefore, could easily have turned out to
have been a total waste of time and effort. Moreover, Professor Weiss and his
colleagues had no way of knowing that this was not the case when they first started
out. What is quite remarkable, therefore, is not only that it actually worked,
but that, by using this technique, they were able to separate out no less than nine
distinct cyclical patterns in the data, each one representing a different
factor affecting climate, with different periodicities ranging from under
twenty years to over two hundred years and with varying effects upon
temperature.
They also made one other extremely important discovery. This
was that there were no non-cyclical patterns in the data: no linear or
exponential progressions of the kind one would have expected them to have found
if a progressive increase in atmospheric carbon dioxide were one of the factors
affecting the climate. This, in itself, therefore, would appear to falsify the
AGW theory. Even more significantly, however – from the point of view of this new fledgling
science of climatology –
of the nine different patterns they did find in the data, they were only able
to positively correlate the two strongest or most dominant with factors already
believed to contribute to overall climate variability.
The first of these was the 65 year oceanic cycle – which includes both the
Atlantic Multidecadal Oscillation (AMO) and the Pacific Decadal Oscillation
(PDO) – during
which ocean temperatures vary by between 0.3°C and 0.5°C
above and below the mean, spending around 30 to 35 years warming and then 30 to
35 years cooling down again.
The second was a cycle which has long been associated with changes
in the climate but which, on the face of it, would appear to have very little
possible connection. This is the 230 to 250 year Grand Solar Cycle, so called in
order to distinguish it from the ordinary 11 year solar cycle, during which the
sun’s magnetic poles invert, the north pole becoming the south and vice versa, a
process which is both regular and continuous and which also produces
fluctuations in the strength of the sun’s overall magnetic field. And it is
these fluctuations which provide us with our first clue as to how solar cycles in
general might possibly affect climate. For just as the earth’s magnetic field protects
us from some of the more harmful effects of solar radiation, so the sun’s
magnetic field protects us from radiation coming from outside of the solar
system – usually
referred to as cosmic radiation –
which primarily consists of free neutrons thrown out into space by exploding
stars.
These have a number of effects on our atmosphere. Colliding
with nitrogen atoms, for instance, they strip the nitrogen nuclei of protons,
thereby turning nitrogen (atomic number 7) into carbon (atomic number 6). They
also break oxygen atoms (atomic number 8) in half, creating beryllium (atomic
number 4). With regard to the issue at hand, however, their most significant
effect is that they also ionise the atmosphere and act a catalyst for turning
water vapour into water droplets, which then form into clouds. The weaker the
sun’s magnetic field, therefore, the greater the cloud formation on earth, and
the greater the consequent albedo effect – the reflection of the sun’s energy back into space – resulting in a cooling of
the climate.
In the case of the ordinary 11 year solar cycle, this effect
is, of course, very small. In fact, in the current political climate, its
existence at all will be categorically denied. According to a new theory developed by a team of astrophysicists led by Professor Valentina Zharkova at the
University of Northumbria, however, these fluctuations in the sun’s magnetic field,
and their consequent effect upon the earth’s climate, are not only replicated in
grand solar cycles but are actually amplified by them, the magnetic field first
becoming stronger and then weaker again in each of the successive 11 year solar
cycles of which the grand solar cycle is comprised, until in the last three to
five cycles, the sun enters a stable but significantly weakened magnetic state
known as a Grand Solar Minimum, the most obvious manifestation of which is an
almost total absence of sun spot activity.
Indeed, it is this lack of sun spots, which otherwise occur
as a regular and wholly predictable effect of the sun’s turbulent polar
inversions, that has allowed solar astronomers to record grand solar minima for
more than four centuries, the most famous example of which being the Maunder
Minimum – named
after solar astronomers Edward and Annie Maunder – which occurred during the second half of the 17th
century, in the middle of what was previously known as the Little Ice Age… until,
of course, Michael Mann wrote it out of existence.
Given the absolutely fascinating nature of the science which
could potentially explain this once universally accepted period of global
cooling, again we have to
ask, therefore, why he should have done this, especially as by simply
following the science, vast vistas of opportunity would seem to be on offer.
I say this because it hardly requires a huge amount of imagination
to see that one could quite easily build a whole career simply by following the
path which Professor Weiss and his colleagues have already laid out: firstly by
verifying the results of the group’s spectral analysis, preferably with a
larger data set, the Weiss group having only had access to European data; then
by identifying and understanding the causal connections between climate variability
and however many cyclical factors the spectral analysis ultimately reveals; and
finally by bringing them all together in a complex climate model which would
hopefully predict future climate change with far more accuracy than currently achieved
by models based purely on levels of carbon dioxide. In fact, if I were a young
climate scientist today, I’d be champing at the bit to participate in just such
a programme of work.
It is at this point, however, that the real problem begins
to reveal itself. For not only would such a programme be very expensive,
requiring a multi-disciplinary approach encompassing fields as diverse as
oceanography and astrophysics, but being of purely academic interest, with no
obvious practical application, it is not easy to see who would fund it. For
without the public policy interest which the AGW theory engenders, climatology
as a separate field of research, independent from either meteorology or
geology, would likely be accorded even less priority today than when it was
first given impetus during the cold war, when the rival world powers, eager to
stake their claim to various parts of Antarctica, had to find something for
their ‘scientific research stations’ to do there, and so set them to drilling
ice-core samples, thereby opening up the Pandora’s Box of unacceptable truths which
has led us, somewhat ironically, into the morass of lies and deceit in which we
currently find ourselves.
I say ‘ironically’ because the initial discovery made by all
these scientific research stations was, of course, that the so-called ‘ice age’
– in the singular – which, until the 1970s,
the earth was thought to have undergone during much of the last one hundred
thousand years but which most people believed had finally and completely ended
around ten thousand years ago, was merely the latest in a whole series of glaciations
and glacial retreats stretching back 2.58 million years, as shown in Figure 2.
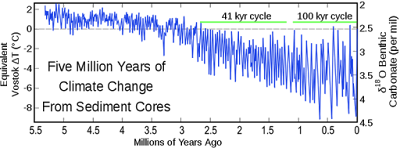

Immediately, there are a number of things you will probably
notice about this chart, the first being that it is based on sedimentary data
rather than ice core samples. This is because the oldest ice core samples so
far extracted – at
the Russian Vostok Station in eastern Antarctica – only come from around 3.7km below the surface,
which is the equivalent of only going back in time around 800,000 years. Although
a truncated graph, covering just this period, would still show a pattern of
warming and cooling –
which is what was first discovered in the 1970s – it would not therefore show the overall cooling
trend that preceded it. And it is to this that I primarily want to draw your
attention.
For although it is still almost universally asserted that
the Pleistocene Quaternary Glaciation, as this greater ‘ice age’ is now known,
came to an end 10,000 years ago, there is absolutely no basis for this
assumption in the data as presented, from which it can be clearly seen that the
cycles of glaciation and glacial retreat have not only been getting longer over
the last 2.58 million years –
going from around 41,000 years in duration at the beginning to around 100,00
year in the last dozen or so cycles –
but have also been getting considerably colder, the last few cycles reaching up
to 9°C below the
Vostok mean. Even if this greater ice age has now bottomed out, therefore – and there is no basis
for this assumption either –
based on this overall trend, the chances are that the earth will still have to
go through another 2.58 million years of gradually warming glacial cycles
before it gets back to the climate of 2.58 million years ago.
And it was this that naturally made all the headlines back in
the mid-1970s when the discovery was first announced: that having just come
through what we now know as the Holocene – the brief warm period of around 10,000 years at the
top of the current cycle –
at some point in the near future –
within the next few hundred years or so, perhaps – the earth is almost certain to enter another period
of glaciation, the prospect of which seemed all the more imminent during the
mid-70s due to the fact that, at that time, before historical temperature data
began to be systematically adjusted downwards – something to which I shall return later – the planet appeared to
be already cooling, the 1950s, 60s and early 70s having been markedly cooler
than the 1930s and 40s. In fact, if one goes back to the unadjusted temperature
data from the pre-war period, one finds that the late 1930’s were actually the
warmest years of the 20th century, with the US in particular
suffering long, hot summers and a period of intense drought known as the ‘dust
bowl’, during which thousands of farmers in the Midwest were driven off their
land and forced to embark upon the mass migration to California famously
commemorated in John Steinbeck’s novel, ‘The Grapes of Wrath’.
With such a devastating drought still very much part of
living memory, and the bitterly cold winters of the 1960s and early 70s a simple
fact of everyone’s life, the fear which people felt at the prospect of another
‘ice age’, as the newspapers still insisted on calling it, was consequently very
real. And yet, still, money for climate research remained in short supply, partly,
one suspects, because there simply wasn’t the institutional infrastructure to
absorb it, but also because climatologists already had a readily available theory
as to why these regular cycles of glaciation and glacial retreat occurred. And
it wasn’t what most people wanted to hear.
I say this because although the correlation was by no means
exact, these newly discovered large scale cyclic variations in the earth’s
climate clearly coincided with the multi-millennial cyclical variations in the
earth’s orbit of the sun which had been worked out more than fifty years
earlier by the Serbian mathematician and astronomer, Milutin Milankovitch.
The Milankovitch cycles, as they are called, describe three
separate aspects of the earth’s solar orbit:
- The shape of the orbit, itself, which, being acted upon by the gravitational pull of the other planets in the solar system – particularly Jupiter and Saturn – is not constant, being more acutely elliptical at some times than others. Even more significantly, as a further consequence of these gravitational distortions, the sun itself is rarely at the centre of the ellipse, usually being closer to one end – known as the perihelion – than the other – known as the aphelion – with the result that the distance between the earth and the sun varies by up to five million miles.
- The difference between the length of the sidereal year – the time it takes for the earth to orbit the sun once – and the calendar year, as measured from midwinter solstice to midwinter solstice and caused by the earth’s wobble on its axis. It may not seem much, but the sidereal year is twenty minutes longer than the calendar year, which means that every calendar year it slips back another twenty minutes from its starting point: a phenomenon known as precession. What this also means, therefore, is that the northern hemisphere’s winters occur at different places in the elliptical orbit, sometimes – for a few thousand years in a row – occurring in the perihelion, when the winters are consequently quite mild, and sometimes – also for a few thousand years in a row – occurring in the aphelion, when the winters are significantly colder.
- The variation in the earth’s axial tilt or obliquity, which ranges from 21.1° to 24.5° and means that during some northern hemisphere winters, the earth is actually pointing further away from the sun than in others. If this happens when the winters are occurring in the aphelion, this therefore makes them even colder.
You will, of course, have noted that I speak here specifically of the northern hemisphere. This is because the land in the northern hemisphere is significantly closer to the polar ice cap than it is in the southern hemisphere. Even though the south pole is actually on land, the Antarctic sea ice would have to leap across hundreds of miles of heat-retaining ocean in order to reach South America, South Africa or Australia. For the Arctic sea ice to claim northern Canada, Siberia and northern Scandinavia, in contrast, it wouldn’t have to move very far south at all. Indeed, it already reaches these northern outposts of the three closest continents each and every winter, blocking any Arctic seaway, and would therefore only require a few cold summers, in which it failed to retreat, for a new period of glaciation to begin.
Despite the undisputed soundness of Milankovitch’s
astronomical calculations and the clear if only approximate correlation between
the earth’s ever changing solar orbit and the cyclical patterns in its
multi-millennial climate history, it is not surprising, therefore, that no
government in the world was particularly keen on giving scientists money to study
this relationship further and thereby provide a more precise date as to when
the next period of glaciation would actually begin. For if, as the Milankovitch
cycles suggested, the earth’s climate is driven by gravitational forces far beyond
the control of any human being, then there was absolutely nothing any
government in the world could do about it. Giving people a more accurate forecast
as to when an ice sheet a mile thick was going to descend upon North America
and Europe would therefore have achieved nothing other than to foster despondency
and a total loss of will to do anything constructive. For make no mistake,
another period of glaciation like the last one, with a drop in global average
temperatures of 9°C,
would mean the death of billions of people, if not the whole of human
civilization.
In the early 1980s, when governments would have been agonizing
over what, if anything, they should do about this problem, it must have seemed like
mana from heaven, therefore, when NASA’s Goddard Institute for Space Studies
(GISS), under the directorship of James Hanson, revived a long-abandoned
theory, first put forward by the Swedish physicist Svante Arrhenius in 1896, which
promised a possible solution. For due to the so-called Greenhouse Gas Effect, Arrhenius
had posited that the increase in atmospheric carbon dioxide which the world had
been experiencing ever since the beginning of the industrial revolution, should
actually lead to an increase in global temperatures, which Hanson now suggested
might be sufficient to counteract the effects of the Milankovitch cycles and hence
remove this looming threat.
What Hanson and his colleagues at NASA GISS failed to inform
the world, however, is why Arrhenius’ theory had been so long abandoned. Whether
or not this was intentional, they entirely neglected to mention the fact that, in
1901, just five years after the theory’s publication, it had been utterly
debunked by another Swedish physicist, Knut Ångström, who empirically
demonstrated that, due to the limited number of signature wave-lengths at which
infra-red radiation is absorbed by carbon dioxide, and the further fact that
most of these wave lengths are also absorbed by water vapour, increases in atmospheric
carbon dioxide could not have anywhere near the effect upon climate that
Arrhenius had claimed. Using an infrared camera, which Ångström himself had developed,
what he discovered, in fact, was that:
- at the shorter wavelengths absorbed by carbon dioxide – those which are also absorbed by the thirty times more plentiful water vapour – all of the infra-red radiation re-emitted by the sun-warmed earth is already absorbed by latter, such that adding more carbon dioxide to the atmosphere has no effect on climate whatsoever, while
- at the longer wavelengths, at which carbon dioxide uniquely absorbs infra-red radiation, the much lower temperatures of the objects from which the radiation is emitted means that the effect is minimal.
Unfortunately, it seems that to governments in the mid-1980s
the actual science was not their primary concern. They were happy merely to be
assured that they were no longer facing an end-of-the-world catastrophe over
which they had no control. As a consequence, they still didn’t really question
the science even when they were told that man-made global warming might not
merely counteract the effects of the Milankovitch Cycles, but might, in itself,
be a threat to the planet. After all, this was something they could control.
They could systematically reduce their nations’ carbon dioxide emissions and
even gain popularity as a result of their virtuous actions in ‘saving the
planet’.
And so the taps were opened and the money flowed, especially
in America and the UK, where climate research very quickly became big business.
In the UK, for instance, the two largest centres of the science are the Hadley
Centre for Climate Prediction and Research at the University of Exeter, which
also houses the UK meteorological office, and the Climate Research Unit at the
University of East Anglia, which, between them, employ more than three hundred
scientists – along
with their associated administrative and auxiliary staff – and jointly produce the
highly influential HadCRUT dataset, which is used by the IPCC in its scientific
assessment reports, and from which an equally influential version of the GAST
or Global Average Surface Temperature is derived.
To those unfamiliar with the way in which climate science is
currently conducted, this concept of the GAST, and the fact that it needs to be
calculated, will probably require some explanation. After all, most people
probably imagine that, these days, the earth’s atmospheric temperature is
measured from space. As indeed it is. Since 1978, microwave sounding units
(MSUs) on polar orbiting satellites, controlled by America’s National Oceanic
and Atmospheric Administration (NOAA), have measured the intensity of microwave
radiation emitted by atmospheric oxygen, from which the temperature of different layers in the atmosphere can be calculated.
Not only are these stratified atmospheric temperatures all significantly
cooler than the earth’s surface temperature, however, but, as stated, they only
go back to 1978. And as with proxy data, one cannot mix and match datasets. If
one wants a longer historical record –
one dating back to 1850, for instance, as in the case of the HadCRUT dataset – one therefore has to go
back to surface temperature records measured in the old-fashioned way, with a
thermometer.
The trouble is, of course, that if one’s objective is to
obtain is a global average surface temperature, this enforced methodology, in
itself, presents a number of almost insurmountable challenges. The first and
most obvious is that weather stations are not evenly distributed about the
globe, with far more in Europe and North America than in Africa, Asia and South
America, and hardly any at all, in fact, in most of the more inhospitable but climatically
critical parts of the world, such as northern Siberia and the Sahara Desert.
Just as importantly, this is also reflected historically, with less and less
records having been kept outside of Europe and North America the further one
goes back in time. In fact, during the first four years of the HadCRUT dataset,
from 1850 to 1853, there is only one actual data point in the whole of the southern
hemisphere, in Indonesia as it happens.
So how do you calculate a global average surface temperature
from such a paucity of actual data? Well it’s a bit like playing a game of
Sudoku. Firstly, you divide the world up into a grid of equal sized areas. Then
you fill in the average temperatures for those areas for which you have actual
data. Then you take two areas for which you have data and extrapolate values
for the areas in between. How? Unfortunately this is not made public. For just
as in the case of Michael Mann’s data and methodology, the institutions which
undertake this work, although publicly funded, claim that their algorithms are
proprietary and the primary source of their income, which they therefore have a
right to protect.
One can, however, make some educated guesses as to the kind
of variables these algorithms would have to include. Take, for example, two
areas on the grid –
call them A and B –
which differ in average temperature by 2°C
and which are separated by four dataless areas. The simplest way to extrapolate
the average temperatures for these transitional areas would therefore be to
divide 2°C by four
and assume that the temperature increases by 0.5°C in each of the areas one passes through in moving
from the colder area A to the warmer area B. Immediately, however, one can see
a number of problems with this. Is the difference in the average temperature
between A and B caused by a difference in altitude, for instance? And if so, is
the gradient constant? Or is the difference between A and B due to the fact
that one is in an urban area while the other is in the countryside, urban areas
generally being two or three degrees warmer than rural ones? If so, how far
does the urban heat island effect (UHIE) radiate into the countryside? And what
happens if one combines these two possibilities? Suppose that both A and B are urban
areas at different altitudes, with colder countryside in between. How does one
calculate these values?
Not, of course, that this particular example is mathematically
very difficult. And I certainly don’t mean to say that the people who work on
these problems don’t generally get the answers right or that they are not
empirically verified wherever possible. There are, however, areas of the world
where the factors affecting the local climate are not only far more complex
than in the above example, but where that complexity itself not only produces
the kind of inhospitable environment where human habitation and hence weather
stations are a rarity, but where it is also that much more difficult to verify
their assumed effects.
Take the world’s oceans, for instance, which cover 71% of
the planet’s surface and which have such a complex thermodynamic interaction
with the atmosphere that even after decades of oceanic-atmospheric studies,
meteorologists still find it difficult to predict the development and course of
hurricanes with any certainty. What’s more, meteorologists do not have to rely
on tethered coastal buoys or ships to feed them surface temperature data in the
way that climatologists do.
Then there are the world’s deserts which, due to a lack of
water vapour in the atmosphere, experience dramatic drops in temperature when
not subjected to direct sunlight. Or the world’s tropical rain forests which,
due to their extreme humidity, hardly experience any change in temperature at
all whether it be day or night. If you look at maps showing the locations of
the worlds weather stations, however, deserts and rain forests hardly figure at
all, meaning that whatever changes in temperature these regions of the world
experience are nearly all extrapolated from somewhere else: somewhere else that
almost certainly does not have these same extreme climatic conditions.
Even more worrying is the fact that, just as in a game of Sudoku,
extrapolated data points become data points from which other data points are
then extrapolated, such that any error in calculating the value for one
particular area can spread and even be amplified across the matrix: a fact
which, I suspect, would have scientists in many other fields raising a
sceptical eyebrow, especially as we are not allowed to see the algorithms by which
these calculated values are generated. Indeed, it’s highly likely that there
would be a good many scientists in other disciplines who would not only
question the scientific soundness of this whole endeavour but would likely
wonder at how it could receive so much public founding while being subject to
so little public scrutiny.
Indeed, it is a question which, I suspect, a good many more people
will have started asking in the last few months, following the publication of
the work of an Australian PhD student called John McLean, whom the guardians of
the HadCRUT dataset inexplicably allowed to audit HadCRUT4, the fourth and latest
version of their dataset.
Presumably, as a humble PhD student, the senior management
at the Hadley Centre and the CRU thought that McLean posed no threat.
Unfortunately for them, he found a publisher who was not only willing but eager
to publish his findings, which detailed over seventy serious errors in the
data.
Admittedly, most of these were just simple mistakes. But even as such, they demonstrate a casualness on behalf of the scientists involved which one would not have expected from people processing such supposedly significant information, especially given that many of the mistakes are so glaring.
Admittedly, most of these were just simple mistakes. But even as such, they demonstrate a casualness on behalf of the scientists involved which one would not have expected from people processing such supposedly significant information, especially given that many of the mistakes are so glaring.
By way of a few examples, there are two separate months, for
instance, when the measured or calculated average temperature for the Caribbean
islands of St. Kitts is recorded as being 0°C. For the whole month of September 1953, to take
another example, a town in Romania was supposed to have experienced an average
temperature of minus 46°C:
the usual average temperature for that month being plus 10°C. Then there is the
temperature data recorded by ships at sea, the geographical coordinates of
which are logged as being up to two hundred miles inland. In fact, reading this
catalogue of glaringly obvious errors, it is almost as if none of the data was ever
actually checked or subjected to quality control, which in turn quite naturally
leads one to question the quality of the systems and processes by which it is
amassed.
Bad as these individual errors are, however, they are as
nothing compared to the numerous systematic adjustments to which the data is subjected, especially with respect to
the Urban Heat Island Effect, which is largely a 20th century
phenomenon. This is because modern building materials – bricks, concrete and tarmac – are much better at absorbing and storing heat than
those which they replaced –
stone, wood and cobbles. With the advent of central heating, buildings also
started to be heated to much higher levels, and although this coincided with an
improvement in insulation, in accordance with the second law of thermodynamics,
all this additional heat always eventually leaks out into the colder surrounding
environment, thereby warming it: something which those responsible for weather
stations in urban areas, especially at universities and other places of
learning, gradually began to recognise as the century progressed.
As a consequence, they therefore slowly began to move these
weather stations into more rural areas or any green, open space the school or
university happened to own, sports fields being a very popular choice. The
result was that average temperatures recorded by these weather stations in the
year immediately following their relocation usually and often quite dramatically
fell. Instead of assuming that the temperature rise at the previous location
had been gradual over a number of years, however, what John McLean discovered
was that the compilers of the HadCRUT dataset assumed rather that the older
temperatures had always been overstated by the difference recorded in the year
of relocation. Instead of adjusting the figures downward on a gradual basis, therefore,
they deducted the entire difference from the whole data history of the weather
station in question, effectively cooling the past by far more than any reasonable
person would regard as warranted.
Nor are the scientists at the Hadley Centre and the CRU
alone in this practice. Over the last couple of decades, the same adjustments
have been systematically made to the datasets compiled by NASA GISS and the NOAA.
Indeed, it is how these institutions, working together, managed to eradicate
the warmer years of the 1930s and 40s. Even more importantly, it is also how
they have managed to maintain their elevated level of public funding. For in
order to keep the money spigots open, the climate science establishment, as a
community of institutions, know that they have to keep public concern over
climate change at a critical level. For all these institutions, therefore, it
is imperative that anything which brings the AGW narrative into question – even the slightest hint
that other factors might be involved in climate variability – has to be suppressed.
Shocking as this is, however, the real problem is that the
corruption does not stop at the laboratory gates. If it did, it would just be a
minor scam. Having embraced the AGW narrative, however, governments around the
world have had to make good on their implicit commitment to do something about
it, and there have been plenty of other scam artists out there who have been
than more than willing to help them: crony capitalists who have no problem
accepting public grants and subsidies in return for largely bogus promises of
limitless clean energy produced from non-viable technologies which are
otherwise so far from being economic that, during their lifetime, they barely recoup
the energy expended in their manufacture, installation and maintenance. Worse
still, in order to fund these grants and subsidies, both taxes and electricity
prices have to be increased for both consumers and businesses alike, thereby suppressing
demand in other parts of the economy, while the intermittent nature of the
energy produced by wind and solar farms is a constant threat to the stability
of any electricity grid which is forced to rely on them, eventually giving rise
to power outages which are even more economically damaging.
At the same time, demands that we eliminate the use of
fossil fuels for transport have forced an already depressed automotive industry
to scrap billions of dollars of cumulative investment in internal combustion technologies
while investing even more billions in the development of alternative electric
vehicles for which there is currently little to no existing refueling
infrastructure and insufficient electricity available to power one even if
there were, our generating capacity having already become too degraded by the
green energy revolution. And to cap it all, it is now being discovered that, because
of their lithium ion batteries, electric cars are not nearly as safe as
everyone imagined, having a tendency to suddenly burst into flames should any
of their battery casings become compromised, allowing the lithium inside to
come into contact with the oxygen in the air and causing them to explode.
But surely, you say, governments employ engineers and
economists to advise them on these matters. If the direction in which we are
currently headed were as misguided and ill-conceived as I say it is, then
surely they would have been told. And you are right, they probably have been.
It’s just that no politician hoping to be re-elected could ever repeat any of
this advice, let alone base their policies on it, while many of them almost
certainly choose to cynically profess a belief in a post-fossil-fuel world in
order to appeal to that small but extremely vocal part of the electorate with
whom it most resonates: the idealistic but largely directionless graduates of
our post-modernist education system for whom the traditional aspirations of getting
married, raising a family and owning their own home now seem as anachronistic
and ideologically defective as they are economically unattainable. When set
beside the yawning chasm of nihilistic emptiness which otherwise beckons, to
many of this generation the idea of ‘saving the planet’ has thus become the one
thing they can cling to: not just as an indubitably good cause to which they
can devote themselves entirely without further need of reason or justification,
but as something which, in its very purposefulness, offers them salvation.
It is hardly surprising, therefore, that the climate change
movement has often been compared to a religious cult. For like a religious cult
it gives meaning to its followers’ lives. Based on such an abstruse foundation,
however – the actual
physics of which few of its followers even claim to understand – it also engenders the
kind of anxiety which naturally comes with the possibility that this ‘meaning’ could
at any time be undermined by some random sceptical thought, and which in turn therefore
fosters an almost hysterical hostility towards any dissenting voice. Like heretics
in the middle ages, ‘deniers’ must consequently be silenced by any means possible,
whether that means de-platforming them and banning them from any form of media,
or removing them from any office they may hold, especially if that office
involves any form of teaching.
What is most disturbing about this descent into mob rule,
however, is not just the rejection of disinterested enquiry and reasoned debate
– or even the existential
malaise which it clearly signifies –
but the fact that, unlike in the middle ages, and the centuries of ever-increasing
enlightenment which followed, science may no longer be able to come to our
rescue. For by abandoning actual science in favour of whatever narrative would garner
public funding, scientists like Michael Mann have not only subverted their own
disciple and weakened the status of science in general, but have undermined the
entire epistemological foundation upon which the modern world is built: a
principled and determined commitment to basing our beliefs solely upon
empirical evidence and reasoned argument, which, until now, has kept our feet firmly
on the ground and our beliefs tethered to reality, and without which all manner
of fantasy, delusion and madness is made possible, including, it seems, the belief
that a colourless, odourless gas, which comprises just 0.04% of the atmosphere
and is essential to all life on earth, is actually a pollutant born of our
nature-despoiling original sin, which, unless we recant and mend our ways, will
eventually see us all burning in hell or plunged beneath the waters of a second
great flood.
It is thus for his contribution to ushering in this new dark
age of ignorance and superstition that Michael Mann is most culpable. And it is
for this, therefore, that he cannot be forgiven.


